Multi-scale analysis by multiple group variables
Yang Zhou
2024-06-06
Source:vignettes/Multiscale_analysis.Rmd
Multiscale_analysis.Rmd1. Introduction
We can use SIGNAL to perform multi-scale analysis of single-cell data to identify cell subtypes specific to tissues, conditions, and developmental stages.
2. Application on the developing human immune cell atlas
In this vignette, we first demonstrate on a recently published developing human immune cell atlas how SIGNAL can be used to integrate in a way that preserves differences between tissues and developmental stages.
2.1 Load data matrix and metadata
We perform data integration on the normalized scRNA-seq gene expression matrix. The HVGs provided by the authors are used.
X = readRDS("/home/server/zy/group_scripts/datasets_preparation/Developing_immune/X.rds")
meta = readRDS("/home/server/zy/group_scripts/datasets_preparation/Developing_immune/meta.rds")
str(X)
## Formal class 'dgCMatrix' [package "Matrix"] with 6 slots
## ..@ i : int [1:201165610] 1 9 10 23 37 44 49 50 52 54 ...
## ..@ p : int [1:884584] 0 491 904 1321 1864 2260 2709 3148 3657 4110 ...
## ..@ Dim : int [1:2] 3765 884583
## ..@ Dimnames:List of 2
## .. ..$ : chr [1:3765] "TNMD" "FGR" "CFH" "CFTR" ...
## .. ..$ : chr [1:884583] "FCAImmP7579224-ATTACTCTCGATGAGG" "FCAImmP7579224-CAGCCGAGTACATCCA" "FCAImmP7579224-TGCTACCTCATGTAGC" "FCAImmP7579224-ACGGCCACAAGCTGAG" ...
## ..@ x : num [1:201165610] 2.211 0.965 0.965 2.015 1.447 ...
## ..@ factors : list()
str(meta)## 'data.frame': 884583 obs. of 4 variables:
## $ Batch : chr "F45" "F45" "F45" "F45" ...
## $ Stage : Factor w/ 11 levels "4 PCW","7 PCW",..: 7 7 7 7 7 7 7 7 7 7 ...
## $ Tissue : Factor w/ 9 levels "Bone Marrow",..: 6 6 6 6 6 6 6 6 6 6 ...
## $ CellType: Factor w/ 13 levels "B cells","Endothelium",..: 8 4 8 8 1 8 8 8 8 8 ...2.2 Visualization of raw data
Colors = distinctColorPalette(13)
pca_res = irlba(t(X), nv = 50)
raw_emb = as.matrix(pca_res$u %*% diag(pca_res$d))
raw_umap = as.data.frame(umap(raw_emb))
colnames(raw_umap) = c("UMAP1", "UMAP2")
raw_umap = cbind.data.frame(meta, raw_umap)
p1 = ggscatter(raw_umap, x = "UMAP1", y = "UMAP2", size = 0.1, color = "CellType", palette = Colors, legend = "right") +
  guides(colour = guide_legend(override.aes = list(size = 2)))
p2 = ggscatter(raw_umap, x = "UMAP1", y = "UMAP2", size = 0.1, color = "Tissue", palette = Colors, legend = "right") +
  guides(colour = guide_legend(override.aes = list(size = 2)))
p3 = ggscatter(raw_umap, x = "UMAP1", y = "UMAP2", size = 0.1, color = "Stage", palette = Colors, legend = "right") +
  guides(colour = guide_legend(override.aes = list(size = 2)))
plot_grid(p1, p2, p3, align = 'h', axis = "b", nrow = 1)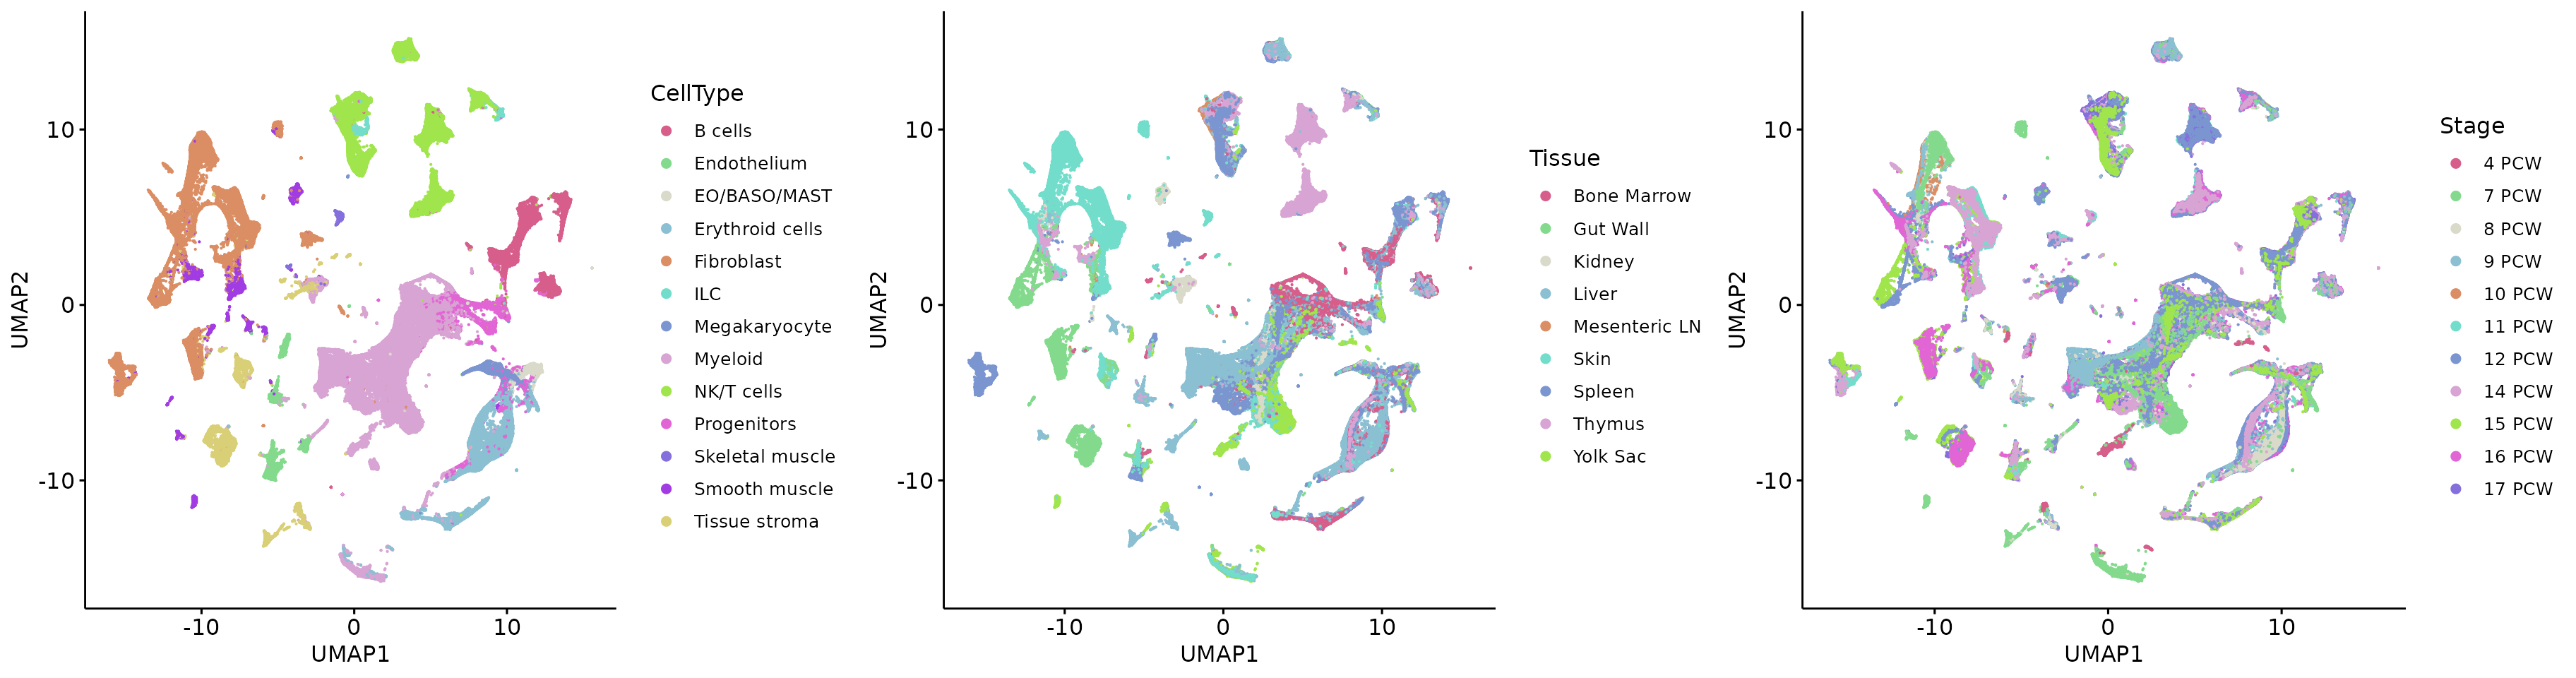
2.3 SIGNAL integration using ‘tissue’ and ‘stage’ as group variables in a two-group setting
## Run gcPCA!## gcPCA done!
signal_umap = as.data.frame(umap(t(signal_emb)))
colnames(signal_umap) = c("UMAP1", "UMAP2")
signal_umap = cbind.data.frame(meta, signal_umap)
q1 = ggscatter(signal_umap, x = "UMAP1", y = "UMAP2", size = 0.1, color = "CellType", palette = Colors, legend = "right") +
  guides(colour = guide_legend(override.aes = list(size = 2)))
q2 = ggscatter(signal_umap, x = "UMAP1", y = "UMAP2", size = 0.1, color = "Tissue", palette = Colors, legend = "right") +
  guides(colour = guide_legend(override.aes = list(size = 2)))
q3 = ggscatter(signal_umap, x = "UMAP1", y = "UMAP2", size = 0.1, color = "Stage", palette = Colors, legend = "right") +
  guides(colour = guide_legend(override.aes = list(size = 2)))
plot_grid(q1, q2, q3, align = 'h', axis = "b", nrow = 1)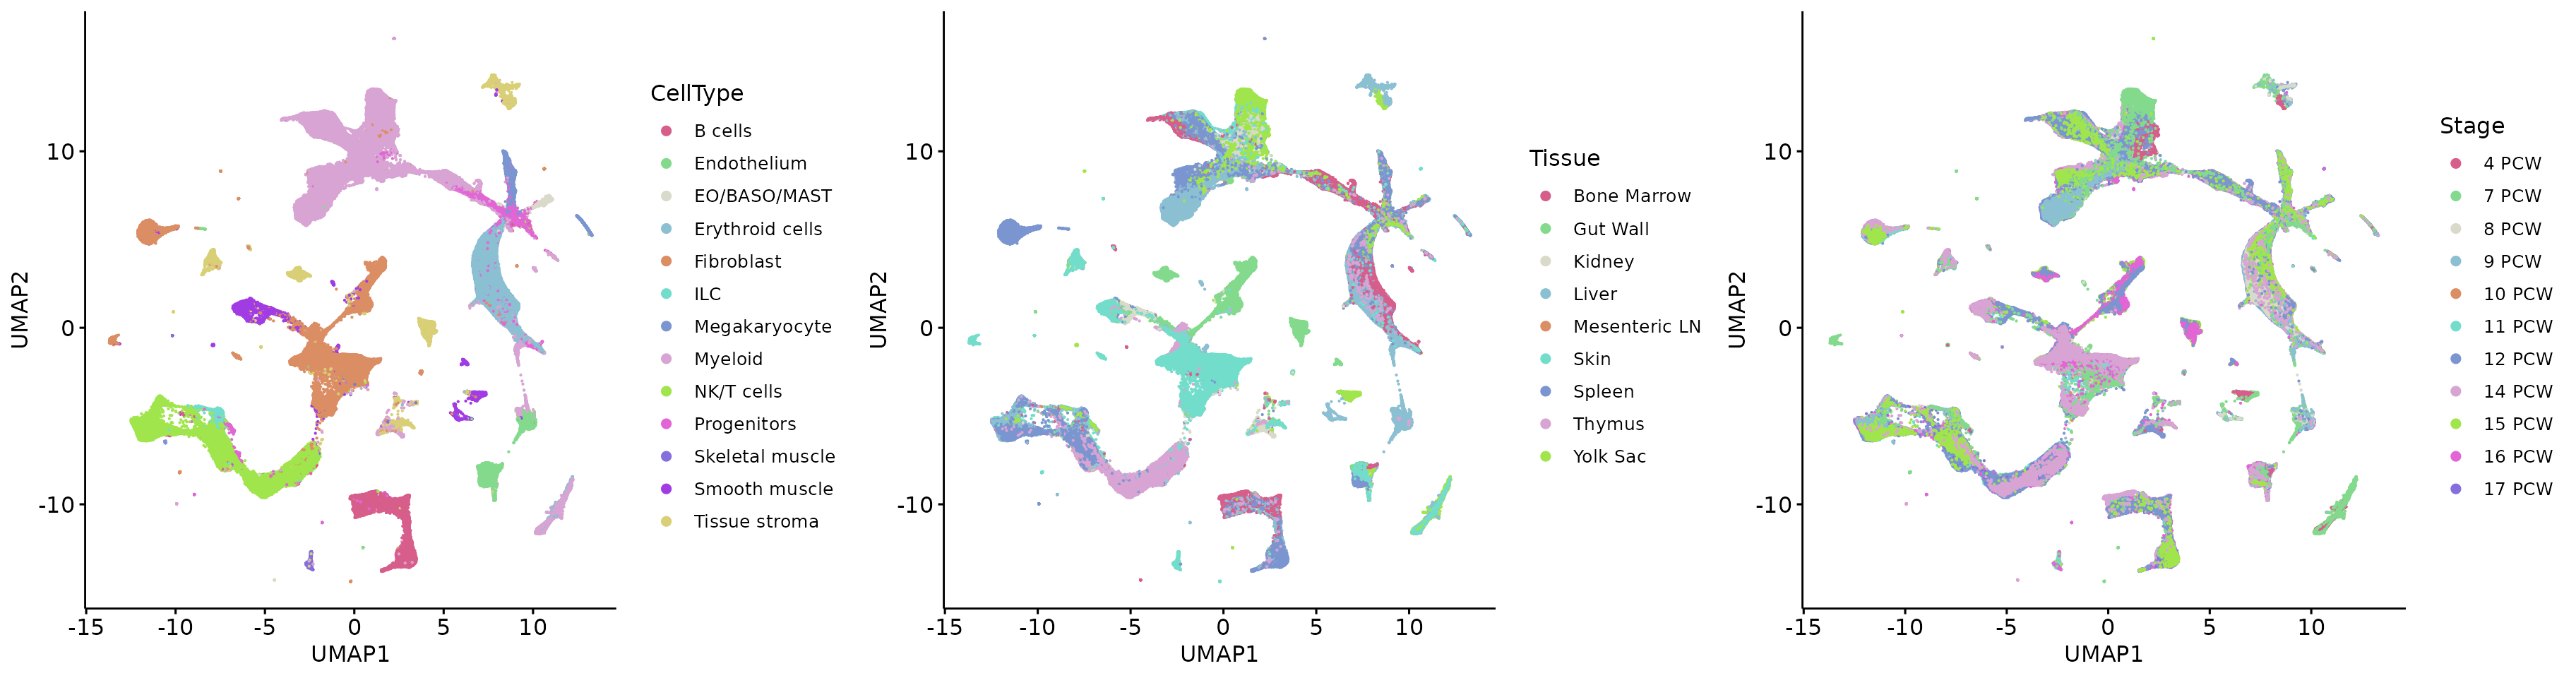
3. Application on the mouse islet atlas
We next apply SIGNAL to integrate a recently published mouse islet atlas using a three-group setting.
3.1 Load data matrix and metadata
We perform data integration on the normalized scRNA-seq gene expression matrix. The HVGs provided by the authors are used.
X = readRDS('/home/server/zy/group_scripts/datasets_preparation/Mouse_islet_atlas/X.rds')
meta = readRDS('/home/server/zy/group_scripts/datasets_preparation/Mouse_islet_atlas/Meta.rds')
str(X)
## Formal class 'dgCMatrix' [package "Matrix"] with 6 slots
## ..@ i : int [1:95717760] 8 11 13 14 15 17 21 22 24 25 ...
## ..@ p : int [1:264019] 0 506 924 1379 1666 1924 2017 2176 2526 2855 ...
## ..@ Dim : int [1:2] 4000 264018
## ..@ Dimnames:List of 2
## .. ..$ : chr [1:4000] "Glycam1" "Ighg2b" "Ighm" "Hbb-bs" ...
## .. ..$ : chr [1:264018] "CAAGATCGTCCAGTTA-1-SRR7610301-NOD_elimination" "GATGAAAGTTGTCGCG-1-SRR7610298-NOD_elimination" "AGTCTTTAGGAGCGTT-1-SRR7610301-NOD_elimination" "CTTCCTTGTACCCAGC-1-MUC13640-VSG" ...
## ..@ x : num [1:95717760] 1.46 2.17 1.46 1.17 1.17 ...
## ..@ factors : list()
str(meta)## 'data.frame': 264018 obs. of 5 variables:
## $ Batch : chr "mouse_pancreatic_islet_atlas_Hrovatin__NOD_elimination__SRR7610301" "mouse_pancreatic_islet_atlas_Hrovatin__NOD_elimination__SRR7610298" "mouse_pancreatic_islet_atlas_Hrovatin__NOD_elimination__SRR7610301" "mouse_pancreatic_islet_atlas_Hrovatin__VSG__MUC13640" ...
## $ CellType: Factor w/ 11 levels "α","β","δ","PP",..: 6 4 8 9 11 4 3 7 4 9 ...
## $ Stage : Factor w/ 9 levels "E","2w","5w",..: 6 6 6 7 4 8 7 7 8 7 ...
## $ Disease : Factor w/ 4 levels "normal","type 1 diabetes mellitus",..: 2 2 2 3 1 3 3 3 3 3 ...
## $ Sex : chr "female" "female" "female" "male" ...3.2 Visualization of raw data
Colors = distinctColorPalette(11)
pca_res = irlba(t(X), nv = 50)
raw_emb = as.matrix(pca_res$u %*% diag(pca_res$d))
raw_umap = as.data.frame(umap(raw_emb))
colnames(raw_umap) = c("UMAP1", "UMAP2")
raw_umap = cbind.data.frame(meta, raw_umap)
p1 = ggscatter(raw_umap, x = "UMAP1", y = "UMAP2", size = 0.1, color = "CellType", palette = Colors, legend = "right") +
  guides(colour = guide_legend(override.aes = list(size = 2)))
p2 = ggscatter(raw_umap, x = "UMAP1", y = "UMAP2", size = 0.1, color = "Sex", palette = Colors, legend = "right") +
  guides(colour = guide_legend(override.aes = list(size = 2)))
p3 = ggscatter(raw_umap, x = "UMAP1", y = "UMAP2", size = 0.1, color = "Disease", palette = Colors, legend = "right") +
  guides(colour = guide_legend(override.aes = list(size = 2)))
p4 = ggscatter(raw_umap, x = "UMAP1", y = "UMAP2", size = 0.1, color = "Stage", palette = Colors, legend = "right") +
  guides(colour = guide_legend(override.aes = list(size = 2)))
plot_grid(p1, p2, p3, p4, align = 'h', axis = "b", nrow = 2)
3.3 SIGNAL integration using ‘sex’, ‘disease’, and ‘stage’ as group variables in a two-group setting
## Run gcPCA!## gcPCA done!
signal_umap = as.data.frame(umap(t(signal_emb)))
colnames(signal_umap) = c("UMAP1", "UMAP2")
signal_umap = cbind.data.frame(meta, signal_umap)
q1 = ggscatter(signal_umap, x = "UMAP1", y = "UMAP2", size = 0.1, color = "CellType", palette = Colors, legend = "right") +
  guides(colour = guide_legend(override.aes = list(size = 2)))
q2 = ggscatter(signal_umap, x = "UMAP1", y = "UMAP2", size = 0.1, color = "Sex", palette = Colors, legend = "right") +
  guides(colour = guide_legend(override.aes = list(size = 2)))
q3 = ggscatter(signal_umap, x = "UMAP1", y = "UMAP2", size = 0.1, color = "Disease", palette = Colors, legend = "right") +
  guides(colour = guide_legend(override.aes = list(size = 2)))
q4 = ggscatter(signal_umap, x = "UMAP1", y = "UMAP2", size = 0.1, color = "Stage", palette = Colors, legend = "right") +
  guides(colour = guide_legend(override.aes = list(size = 2)))
plot_grid(q1, q2, q3, q4, align = 'h', axis = "b", nrow = 2)
Session Info
## R version 4.2.3 (2023-03-15)
## Platform: x86_64-conda-linux-gnu (64-bit)
## Running under: Ubuntu 22.10
##
## Matrix products: default
## BLAS/LAPACK: /home/server/anaconda3/envs/zy/lib/libopenblasp-r0.3.21.so
##
## locale:
##  [1] LC_CTYPE=en_US.UTF-8       LC_NUMERIC=C
##  [3] LC_TIME=en_US.UTF-8        LC_COLLATE=en_US.UTF-8
##  [5] LC_MONETARY=en_US.UTF-8    LC_MESSAGES=en_US.UTF-8
##  [7] LC_PAPER=en_US.UTF-8       LC_NAME=C
##  [9] LC_ADDRESS=C               LC_TELEPHONE=C
## [11] LC_MEASUREMENT=en_US.UTF-8 LC_IDENTIFICATION=C
##
## attached base packages:
## [1] stats     graphics  grDevices utils     datasets  methods   base
##
## other attached packages:
## [1] cowplot_1.1.1       randomcoloR_1.1.0.1 ggpubr_0.6.0
## [4] ggplot2_3.4.4       uwot_0.2.2          irlba_2.3.5.1
## [7] Matrix_1.5-4.1      SIGNAL_1.0.0
##
## loaded via a namespace (and not attached):
##  [1] matrixStats_1.0.0        fs_1.6.4                 flock_0.7
##  [4] RcppAnnoy_0.0.22         doParallel_1.0.17        tools_4.2.3
##  [7] backports_1.4.1          bslib_0.7.0              utf8_1.2.4
## [10] R6_2.5.1                 BiocGenerics_0.44.0      colorspace_2.1-0
## [13] withr_3.0.2              tidyselect_1.2.1         bit_4.0.5
## [16] curl_5.2.1               compiler_4.2.3           bigparallelr_0.3.2
## [19] textshaping_0.3.7        cli_3.6.3                BiocNeighbors_1.16.0
## [22] desc_1.4.3               labeling_0.4.3           sass_0.4.9
## [25] scales_1.3.0             pkgdown_2.0.7            systemfonts_1.0.6
## [28] stringr_1.5.1            digest_0.6.35            rmarkdown_2.26
## [31] pkgconfig_2.0.3          htmltools_0.5.8.1        sparseMatrixStats_1.10.0
## [34] MatrixGenerics_1.10.0    fastmap_1.1.1            highr_0.10
## [37] rlang_1.1.4              rstudioapi_0.15.0        jquerylib_0.1.4
## [40] generics_0.1.3           farver_2.1.1             jsonlite_1.8.8
## [43] mclust_6.0.0             BiocParallel_1.32.6      dplyr_1.1.4
## [46] car_3.1-2                magrittr_2.0.3           Rcpp_1.0.12
## [49] munsell_0.5.1            S4Vectors_0.36.2         fansi_1.0.6
## [52] abind_1.4-5              lifecycle_1.0.4          stringi_1.8.3
## [55] yaml_2.3.8               carData_3.0-5            Rtsne_0.17
## [58] grid_4.2.3               parallel_4.2.3           lattice_0.21-8
## [61] knitr_1.46               ps_1.7.6                 pillar_1.9.0
## [64] ggsignif_0.6.4           bigstatsr_1.5.12         codetools_0.2-19
## [67] stats4_4.2.3             bigassertr_0.1.6         glue_1.8.0
## [70] evaluate_0.23            V8_4.4.2                 vctrs_0.6.5
## [73] foreach_1.5.2            gtable_0.3.5             purrr_1.0.2
## [76] tidyr_1.3.1              cachem_1.0.8             xfun_0.43
## [79] broom_1.0.5              RcppEigen_0.3.4.0.0      ff_4.0.12
## [82] RSpectra_0.16-1          rstatix_0.7.2            ragg_1.2.7
## [85] tibble_3.2.1             iterators_1.0.14         memoise_2.0.1
## [88] cluster_2.1.4            rmio_0.4.0